Real-time metrics
PgDog Enterprise collects and transmits its own metrics to the control plane, at a configurable interval (1s, by default). This provides a real-time view into PgDog internals, without a delay that's typically present in other monitoring solutions.
How it works
Real-time metrics are available in both Open Source and Enterprise versions of PgDog. The open source metrics are accessible via an OpenMetrics endpoint or via the admin database.
In PgDog Enterprise, the same metrics are collected and sent via a dedicated connection to the control plane. Since metrics are just numbers, they can be serialized and sent quickly. To deliver second-precision metrics, PgDog requires less than 1KB/second of bandwidth and little to no additional CPU or memory.
Configuration
The intervals at which metrics are uploaded to the control plane are configurable in pgdog.toml:
[control]
metrics_interval = 1_000 # 1s
endpoint = "https://control-plane-endpoint.cloud.pgdog.dev"
token = "cff57e5c-7c4f-4ca0-b81c-c8ed22cf873d"
The default value is 1 second, which should be sufficient to debug most production issues.
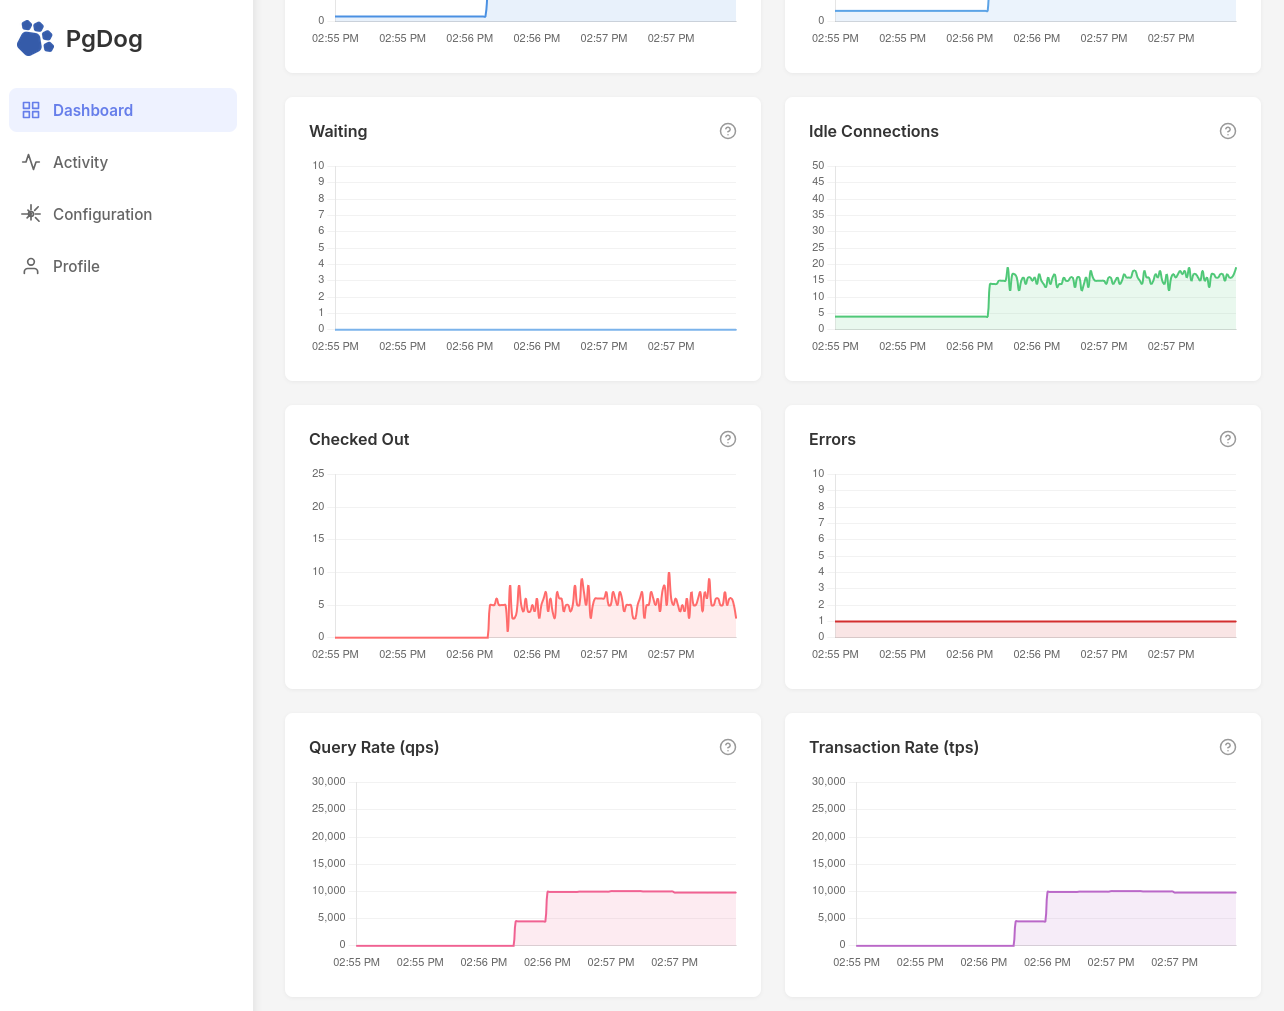
Web UI
Once the metrics reach the control plane, they are pushed down to the web dashboard via a real-time connection. Per-minute aggregates are computed in the background and stored in a separate PostgreSQL database, which provides a historical view into overall database performance.
Available dashboard metrics
Dashboard metrics are distinct from the OpenMetrics endpoint. They use millisecond units throughout and are collected at specified intervals.
Connection pool
| Metric | Description |
|---|---|
| Clients | Total number of connected clients. |
| Server Connections | Total server connections open across all pools. |
| Connection Rate (cps) | Average number of connections established to servers per second. |
| Waiting | Clients waiting for a connection from a pool. |
| Max Wait (ms) | How long the first (oldest) client in the queue has waited, in milliseconds. |
| Idle Connections | Servers available for clients to use. |
| Idle in Transaction Connections | Servers currently idle in transaction. |
| Checked Out | Servers currently serving client requests. |
| Instances | Number of PgDog instances currently connected to the control plane. |
Errors
| Metric | Description |
|---|---|
| Errors | Errors that connections in the pool have experienced. |
| Server Errors | Errors returned by server connections. |
Query throughput
| Metric | Description |
|---|---|
| Queries | Total number of executed queries. |
| Transactions | Total number of executed transactions. |
| Transaction Rate (tps) | Average number of executed transactions per statistics period. |
| Query Rate (qps) | Average number of executed queries per statistics period. |
| Blocked Queries | Queries blocked by lock contention. |
Timing and latency
| Metric | Description |
|---|---|
| Query Time (ms) | Total time spent executing queries. |
| Transaction Time (ms) | Total time spent executing transactions. |
| Idle in Transaction Time (ms) | Total time spent idling inside transactions. |
| Wait Time (ms) | Total time clients spent waiting for a server connection. |
| Query Response Time (ms) | Total client-observed query latency, including connection wait time. |
| Transaction Response Time (ms) | Total client-observed transaction latency, including connection wait time. |
Max Wait vs Wait Time
Max Wait captures the worst single waiter at one instant. It drops to zero the moment that client is served.
Wait Time measures total queuing burden across all clients. It stays elevated when many clients are waiting briefly. Use both together: high Max Wait with low Wait Time points to a single slow client; high Wait Time with low Max Wait indicates widespread shallow queuing.
Network throughput
| Metric | Description |
|---|---|
| Bytes Received (MB) | Total number of bytes received. |
| Bytes Sent (MB) | Total number of bytes sent. |
Memory and caching
| Metric | Description |
|---|---|
| Prepared Statements | Number of prepared statements in the cache. |
| Prepared Statements Memory (MB) | Number of bytes used for the prepared statements cache. |
| Query Cache Size | Number of queries in the cache. |
| Query Cache Hits | Queries already present in the query cache. |
| Query Cache Misses | New queries added to the query cache. |
| Query Cache Hit Rate (%) | Percentage of queries served from the query cache. |
| Direct Shard Queries | Queries sent directly to a single shard. |
| Cross-Shard Queries | Queries sent to multiple or all shards. |
| Direct Shard Hit Rate (%) | Percentage of queries that avoided a cross-shard fanout. |
Query stats
| Metric | Description |
|---|---|
| Query Stats Tracked Queries | Number of unique query fingerprints currently tracked. |
| Query Stats Memory (MB) | Memory consumed by the query stats store. |